
Predicting Comcast Xfinity Internet Outages
My home internet disconnected every day, multiple times per day. I noticed a pattern in the outages. Here is how I collected and used data to prove it.
There was a pattern
My home internet disconnected every day, multiple times per day.
It never went out for long, at most 15 minutes at a time, but it made doing anything that required a constant connection extremely frustrating. Of course this always happened during the hottest part of the day, during the Houston summer where it is so hot and humid out all you want to do is stay inside and watch Netflix. Netflix and chill, but in the more literal sense of chill.
After a few weeks of this I started contacting Comcast, and even after a couple tech visits, they couldn't find any problems. They could see the outages on their end, but they claimed everything looked fine on my end. But it was clearly not.
This was going on for so long, I started to notice a pattern. It would start happening around 11:00 a.m. and would stop around 6:00 p.m. From then it would work fine the rest of the night. It always happened during the hottest part of the day. I started mentioning this idea when talking to the Comcast technical support team, but they weren't really interested in my theory. But I really felt there was something to this. I just needed the data to prove it.
Collecting the data
Internet data
To track my internet outages consistently I created a simple python script that would ping a website and log the result to a database. To verify the outage was actually the internet, and not a problem with my local network, I also had the script ping a local media server I have running on my home network 24/7.
I setup a Raspberry Pi I had on hand to execute this script every 10 minutes, and I let it run and collect data for 3 months.
Weather data
Additionally, I created a script to request local weather data from a publicly available API. This weather data was updated approximately once an hour so I had my Pi execute this script hourly. I also logged this returned data to a second table in the database.
The results are in
With the data in hand, we can now look at how often my internet did indeed go out. Out 2,122 hours I was collecting data, we can see my internet was out, at least one time, during 178 of them.
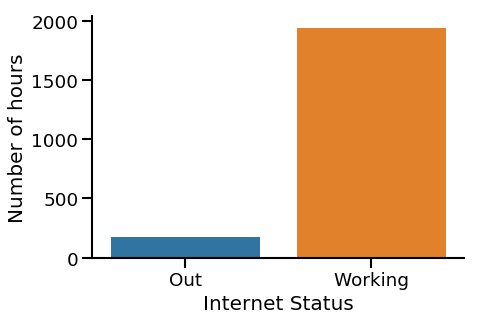
That seems a little excessive to me.
I really felt this was associated with the weather outside, and with this data we can investigate that suspicion. Over the course of the 3 months, we can view the average temperature, humidity, pressure, and internet connection status side-by-side. The value of the internet status is related to the proportion of time it was out during that hour. Higher means it was on, lower means it was out.
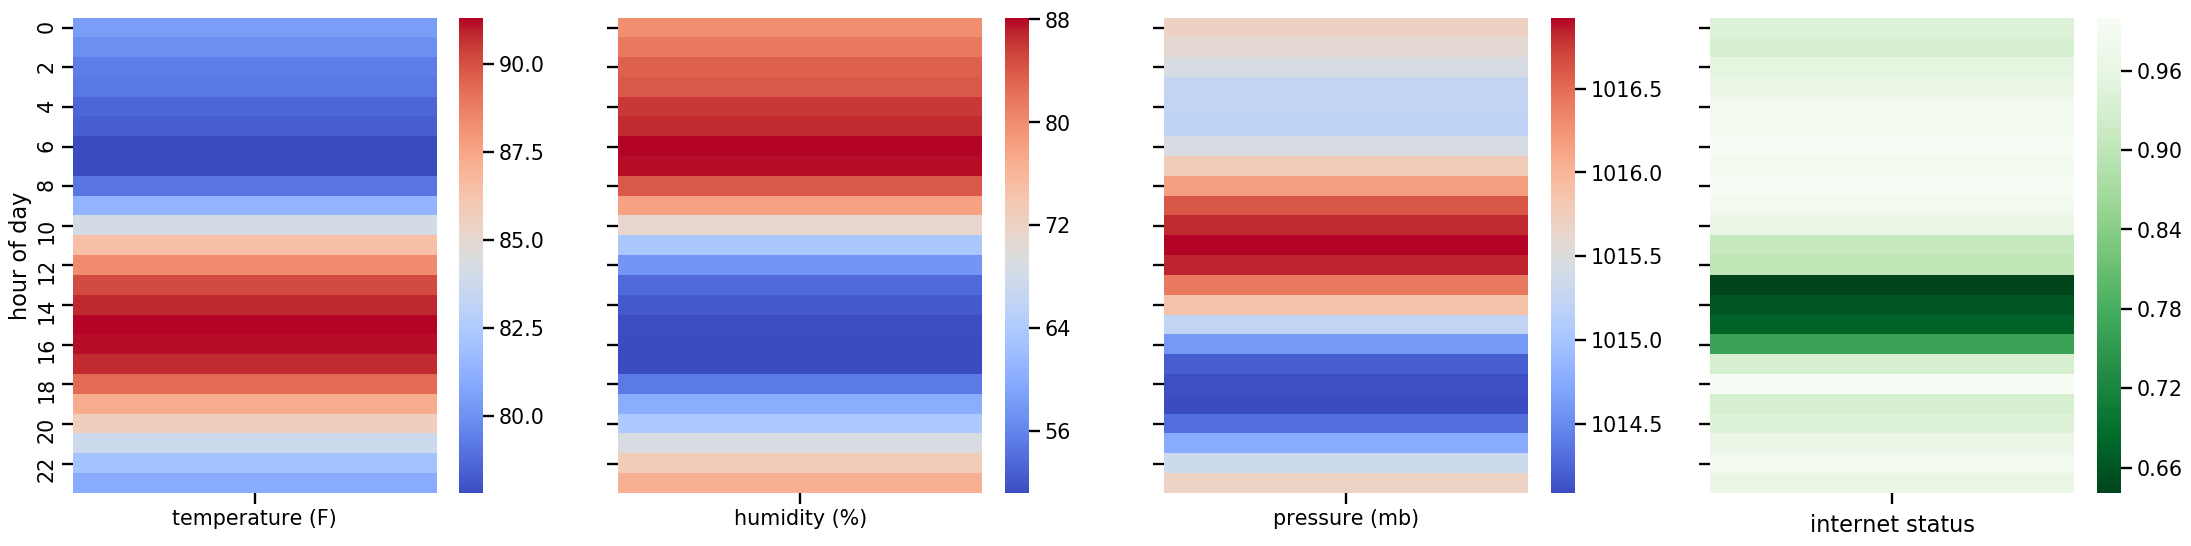
I felt pretty vindicated at this point. There really was an association with the time of the day. I wasn't crazy.
I believed this association was driven by the temperature, but we need to look at the data a different way to actually see that.
Looking at the hourly temperature over several days one striking feature is clear. For the three days where the temperature stayed below 90 degrees, the internet did not go out. You can see this on July 4th, 8th, and 9th.
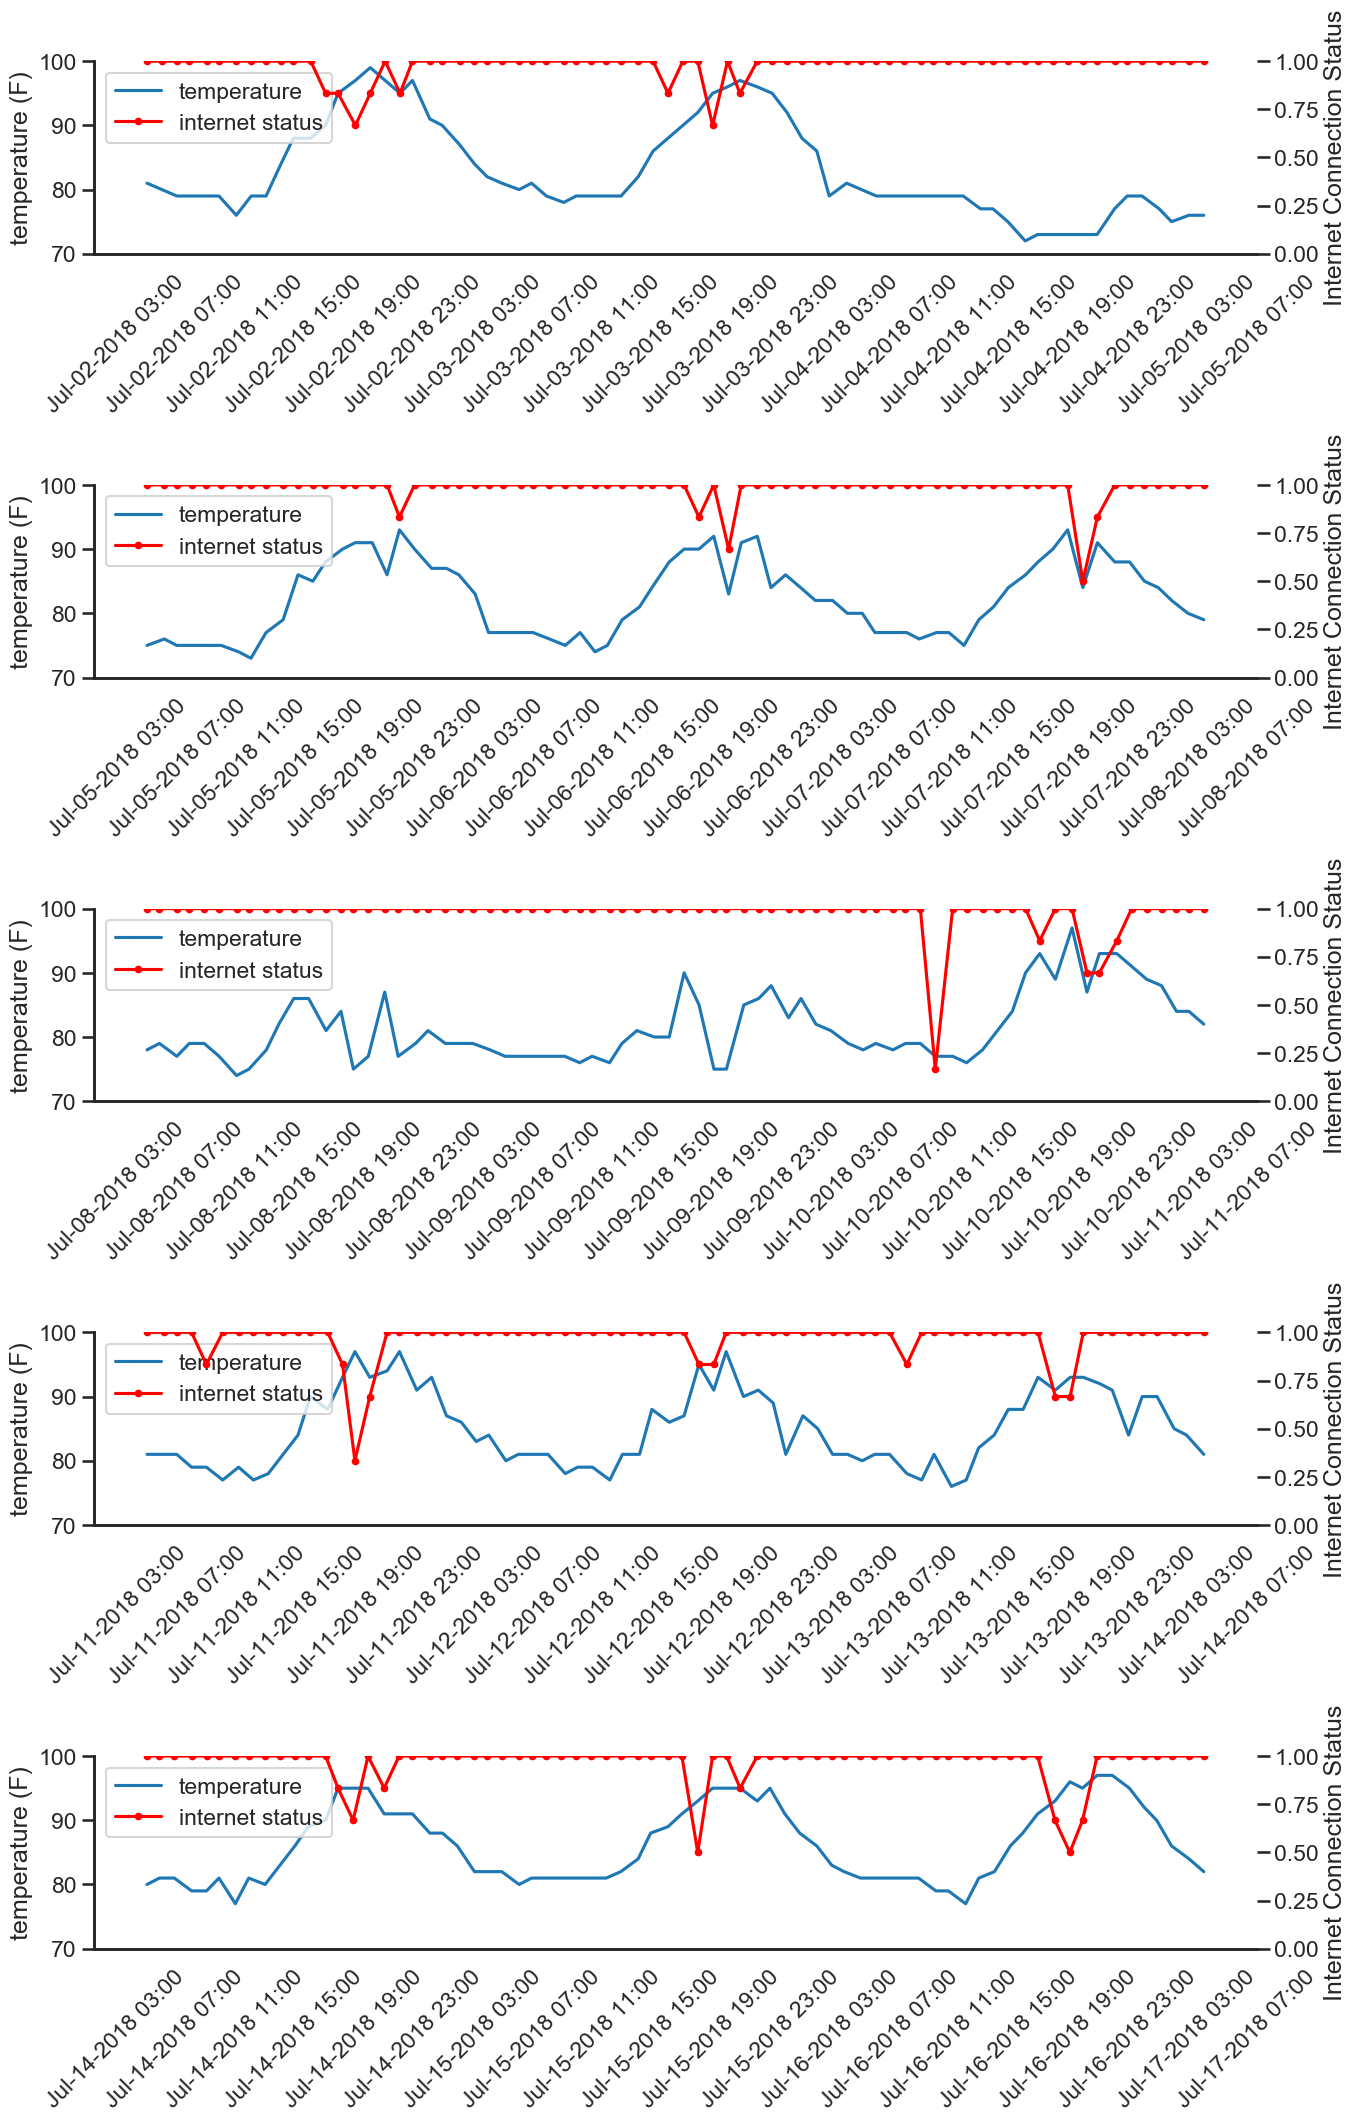
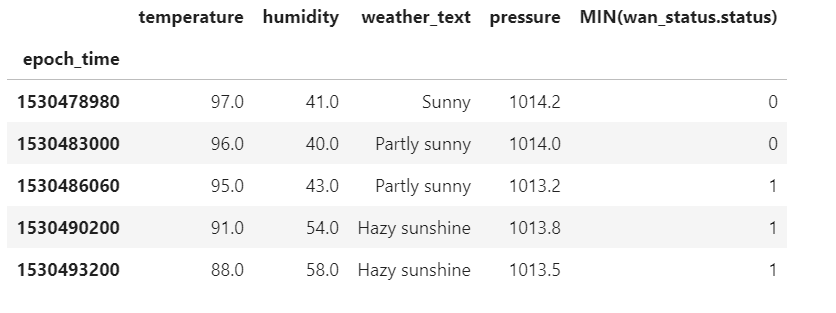
I still believe temperature is behind this. But, this is only 15 days shown above, it could very well be a coincidence. I next decided to use all 2000+ hours of data and do some predictive modeling. After including some weather text-data and filtering out the columns for dates I have the following data table to use in my predictions. MIN(wan_status.status) indicates the internet connection during that hour; 0 it went out at least once, 1 it stayed on.
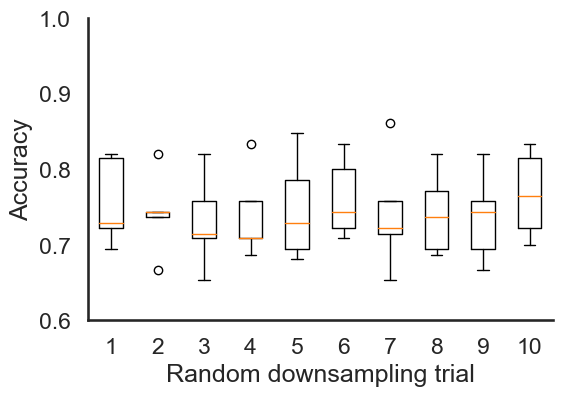
In Fig 1 you can see this is a high degree of class imbalance. To account for this, I just down-sampled the larger class to make them equal. Using a random forest classifier I performed 10 random down-samplings and performed 5-fold cross-validation each time. While there is some variation in the accuracy of predictions which each random sampling, they do tend to hover around the 75% mark, suggesting the down-sampling is capturing a fair sample of the data.
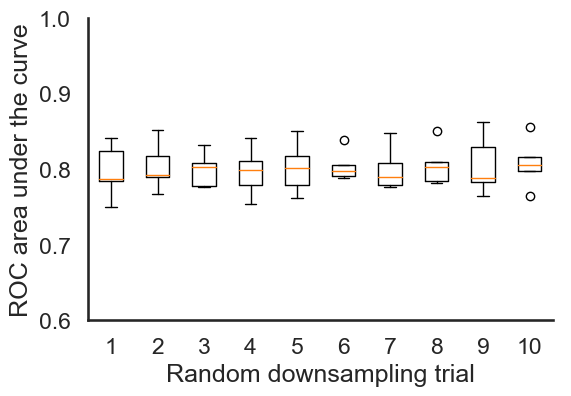
Instead of accuracy, we can also use the area under the receiver operating characteristic curve (AUC) as well. It shows the same consistency with scores all around 0.8 for each trial. This is good!
For one final down-sampling we can now do several random train-test splits and plot the receiver operating characteristic curves for each to check the quality of this random forests model.
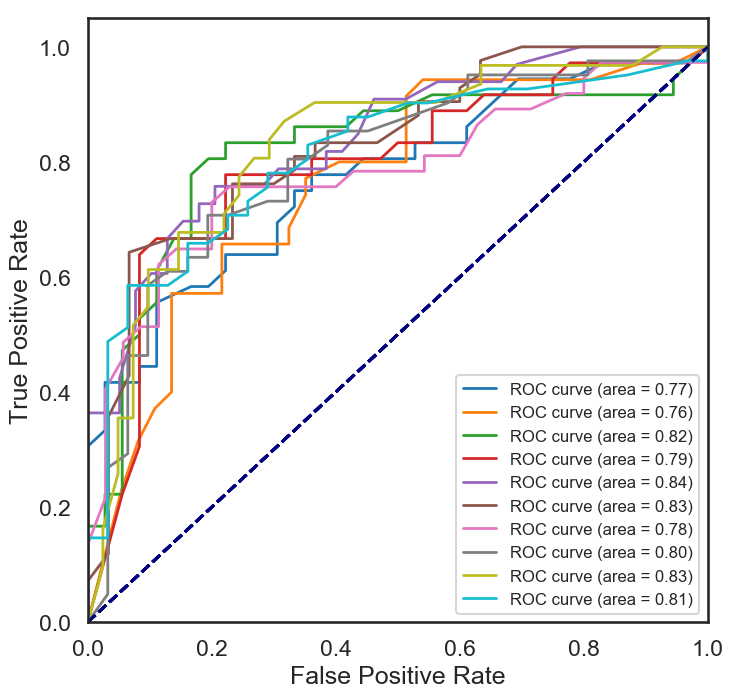
The average AUC for those splits is 0.80, and that is pretty good.
So what does all this mean?
What all of this is telling me is that for any given hour of the day, there is a good predictive relationship between the current weather outside my house and the chance my internet is going to disconnect.
We can check this one last way by looking at the feature importance of the trained random forests model.
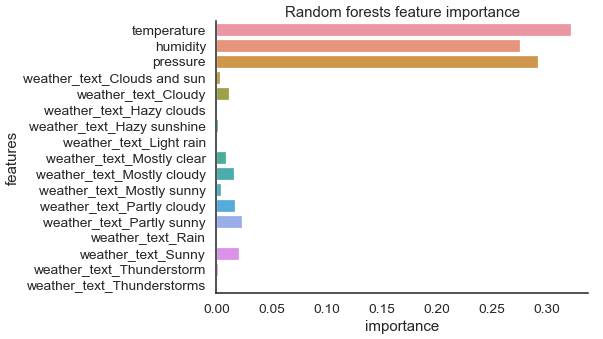
The most important feature of the model is temperature! This was what I initially suspected, and this data and model both support this hypothesis.
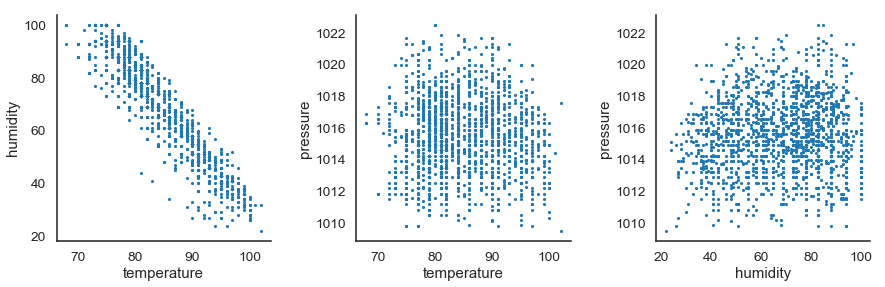
Pressure and humidity were also highly predictive in the model. Humidity is likely predictive do to its high correlation with temperature. However, pressure is an interesting predictor that I don't know if I can completely explain.
Epilogue
So I know what your wondering. "Did Comcast care about any of this? Did they look at the data you collected and be okay there is something going on here with the temperature?".
This probably won't surprise you but no, they didn't really care.
The problem did finally get fixed, though. On tech visit number four, the tech finally followed the home-run of my coax wiring into my attic and found a damaged barrel connector. The best way the describe it is if you pulled on the cable really hard and caused it to retract slightly from the hole where it connects.
The working theory is that this damaged connector was normally fine, but on hot summer days (where the attic temperature could easily reach 130 degrees F) the heat caused expansion in some parts of the cable or connector, and this expansion was enough to disrupt the signal in the already compromised cable/connector.
On that fourth visit the tech replaced that connector, and the internet has not gone out since.